
Nossos melhores spreads e condições
 Saiba mais

NZD/USD is under pressure towards a critical area of supporting structure. However, the bulls are moving in and there are prospects of a move to test a key area of resistance as the following analysis will illustrate:


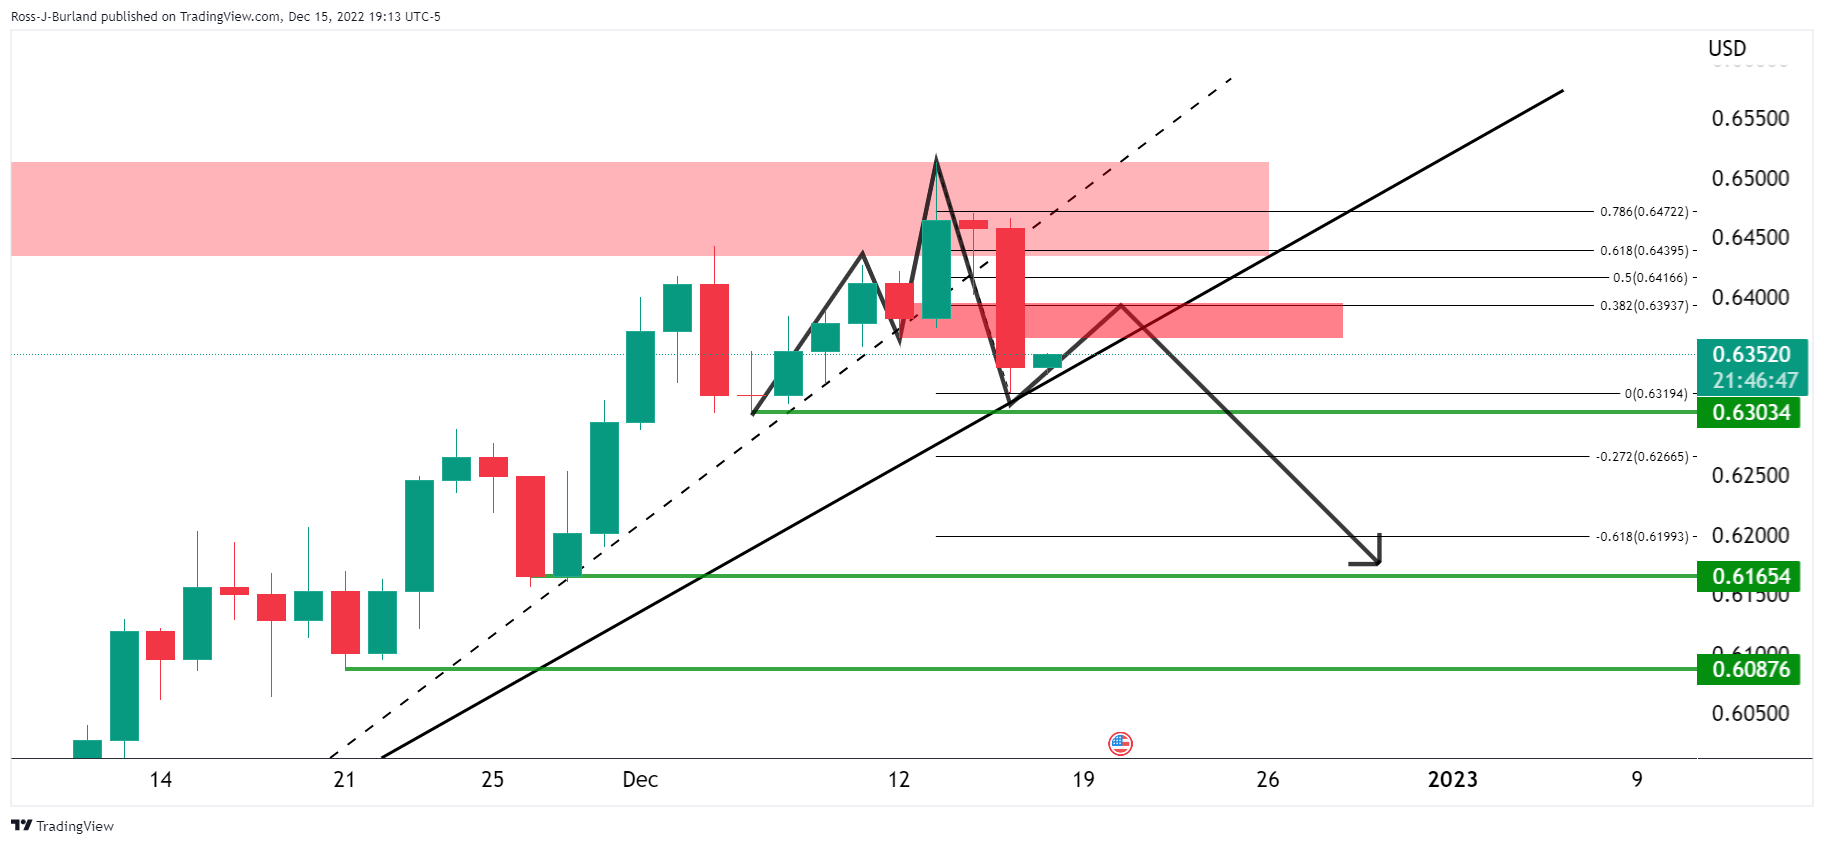
The price has carved out an M-formation as it homes in on the major dynamic trendline support and the round 0.63 figure horizontal support.
The pattern is a reversion formation and the price would be expected to restest the neckline prior to the next surge to the downside. The 38.2% Fibonacci retracement level has a confluence of this area near 0.6390/00. A break of 0.6300 opens risk to 0.6150/65 and then 0.6080/00.
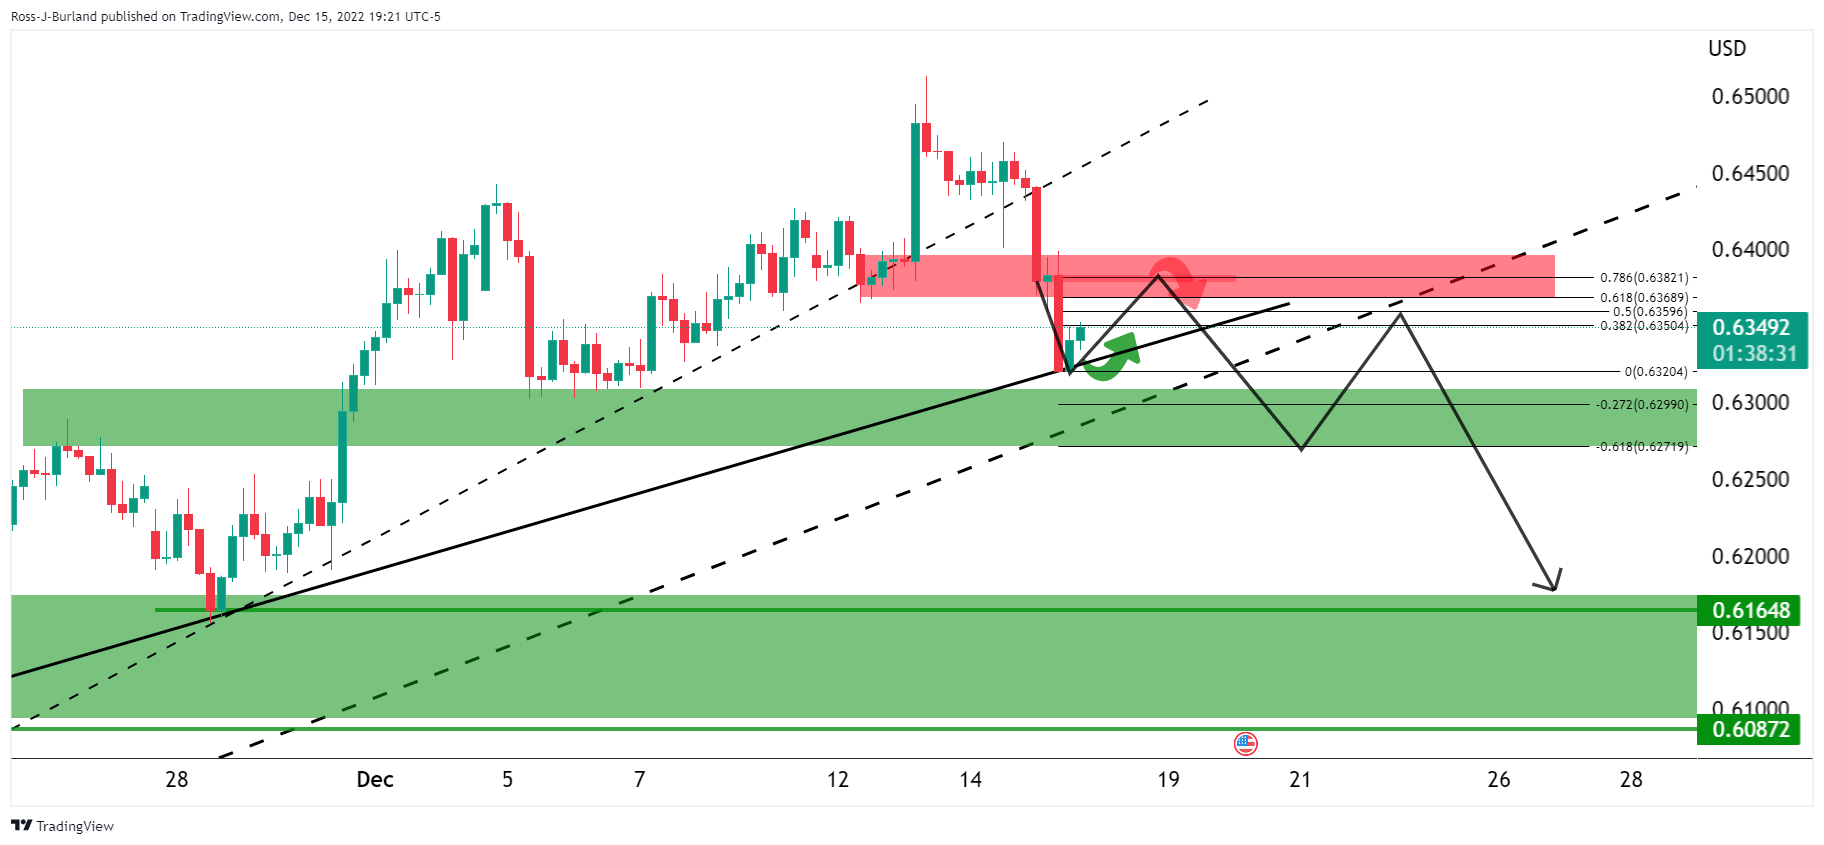
The 4-hour time frame shows the price correcting towards the upside, in accordance to the above daily chart analysis.


