Confirming you are not from the U.S. or the Philippines

Ao fornecer esta declaração, declaro e confirmo explicitamente que:
  • Não sou um cidadão nem residente nos EUA
  • Não sou residente nas Filipinas
  • Não possuo, direta ou indiretamente, mais de 10% de ações/direitos de voto/juros dos residentes dos EUA e/ou não controlo cidadãos ou residentes dos EUA por quaisquer outros meios
  • Não tenha propriedade, direta ou indireta, de mais de 10% de ações/direitos de voto/juros e/ou controlo cidadãos ou residentes dos EUA exercidos por outros meios
  • Não sou afiliado de cidadãos ou residentes dos EUA nos termos da Secção 1504(a) da FATCA
  • Tenho consciência da minha responsabilidade por prestar declarações falsas.
Para efeitos da presente declaração, todos os países e territórios dependentes dos EUA são equiparados de igual modo ao território principal dos EUA. Comprometo-me a defender e a considerar isenta a Octa Markets Incorporated, os seus diretores e oficiais relativamente a quaisquer reivindicações que surjam ou estejam relacionadas com qualquer violação da minha declaração no presente documento.
Dedicamo-nos à sua privacidade e à segurança das suas informações pessoais. Coletamos e-mails apenas para fornecer ofertas especiais e informações importantes sobre nossos produtos e serviços. Ao enviar seu endereço de e-mail, você concorda em receber nossas cartas. Se desejar cancelar a assinatura ou tiver alguma dúvida ou preocupação, entre em contato com o nosso Suporte ao Cliente.
Octa trading broker
Abrir conta de negociação
Back

AUD/JPY Price Analysis: Cross enters in consolidation phase, downturn likely momentary

  • Daily chart indicators suggest correction phase sets in; RSI drops signifying easing of overbought conditions.
  • Hourly chart indicators remain in negative territory, signaling downside correction in the near term.
  • Bulls show signs of exhaustion, unable to retest 105.00 highs.

In Wednesday's session, the AUD/JPY pair displayed signs of correction, retreating to the 104.30 mark following an earlier surge to 104.90. Seemingly, buyers are finding it tough to maintain upward traction. The market appears to have started a short-term correction phase.

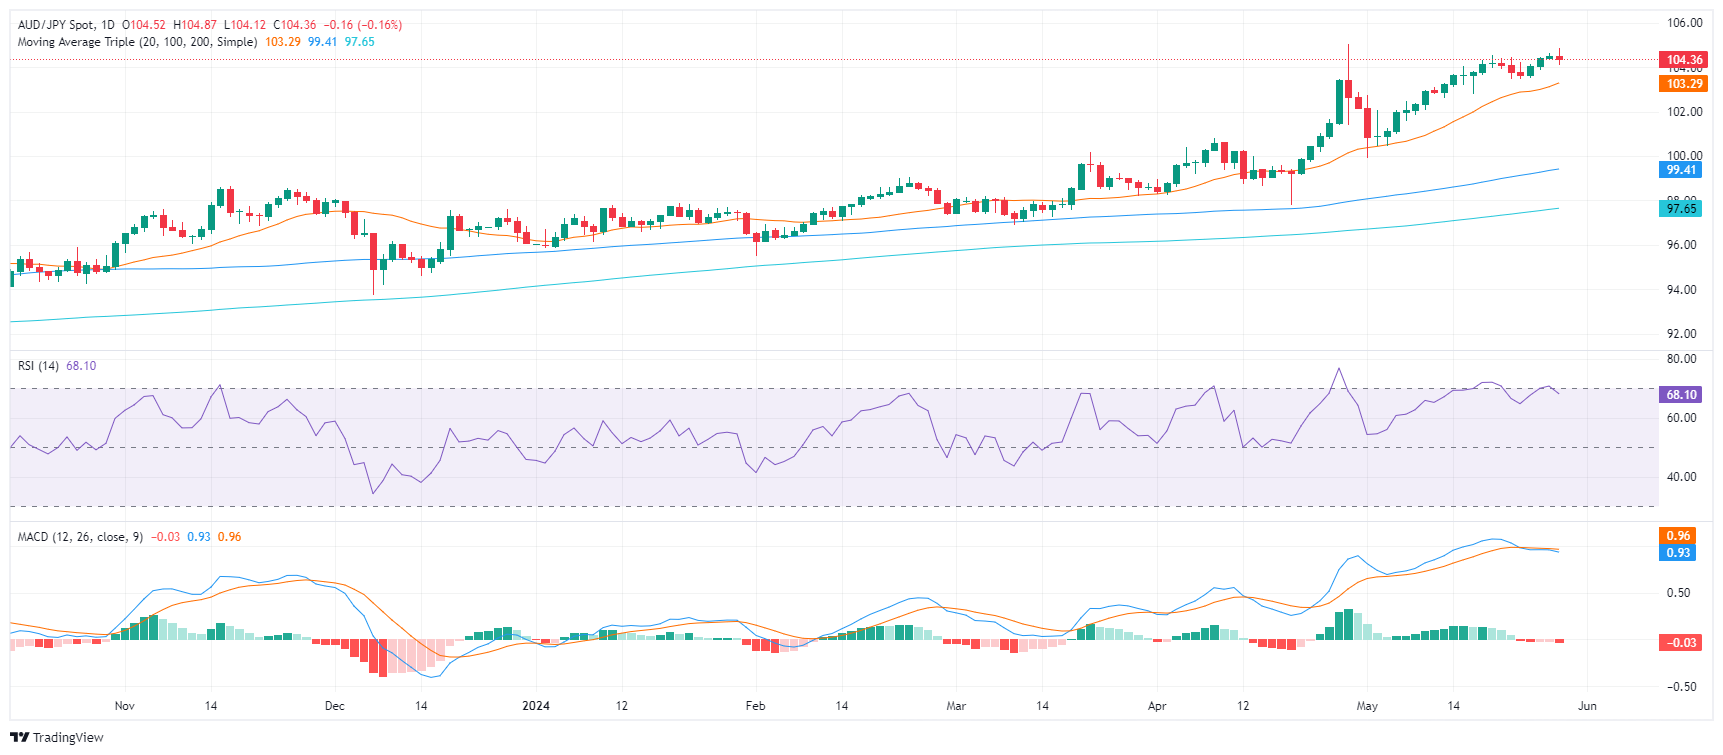
On the daily chart, the RSI has edged down to 67 territory, indicating easing of earlier overbought conditions. In sync with this, MACD continues to print red bars, further solidifying the possibility of weakening buying power.

AUD/JPY daily chart
Reiterating these sentiments is the hourly chart. The RSI and MACD both remain in negative territory, indicating a probable near-term correction.

AUD/JPY hourly chart
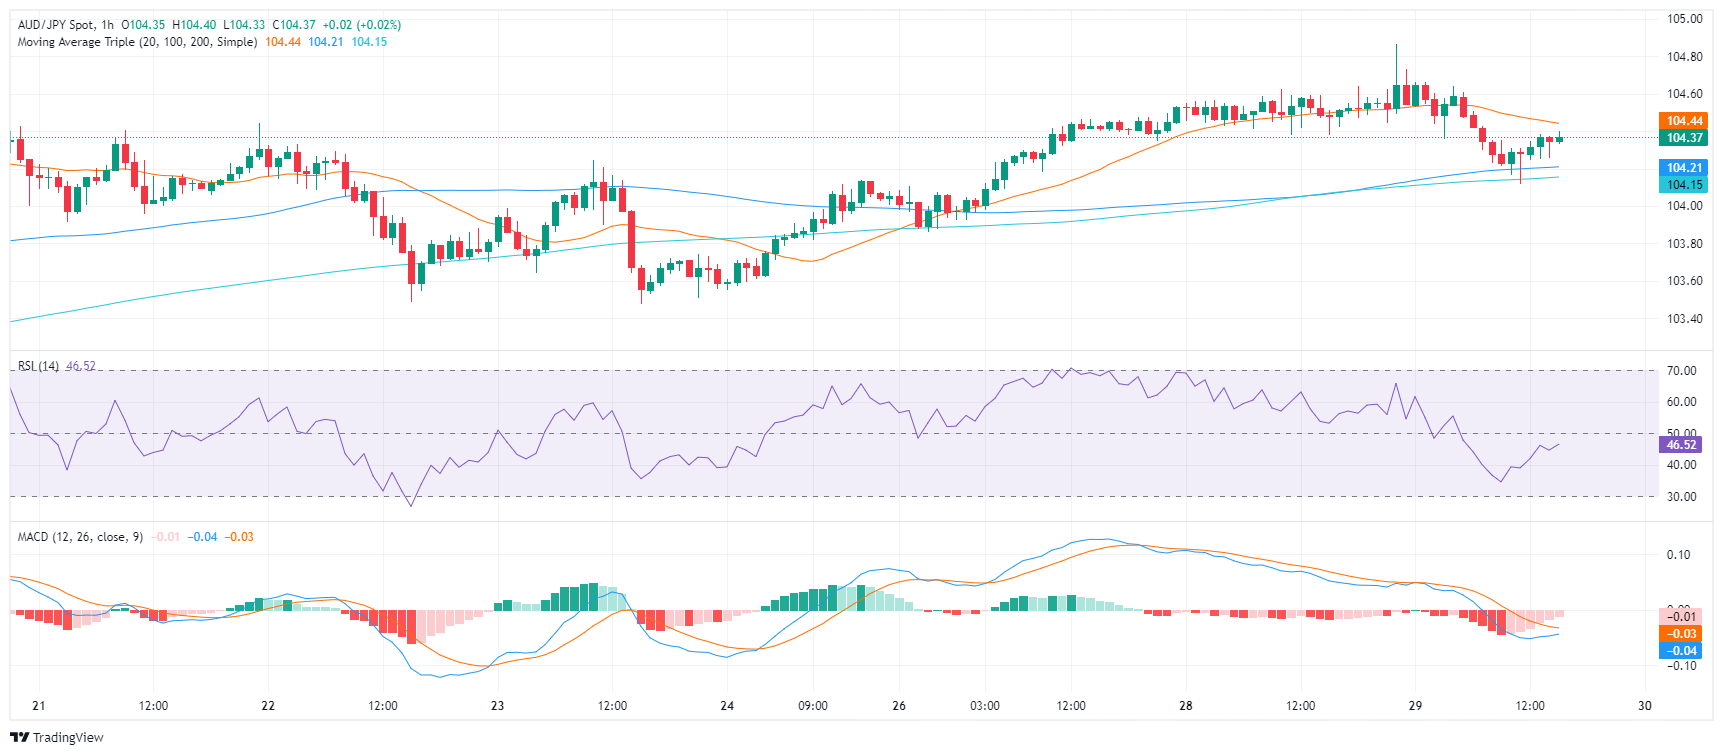
The prominent resistance remains the cycle high just above 105.00 while the 20-day SMA, now at 103.29, continues to provide strong support.


AUD/JPY

Overview
Today last price 104.38
Today Daily Change -0.14
Today Daily Change % -0.13
Today daily open 104.52
 
Trends
Daily SMA20 103.12
Daily SMA50 101.15
Daily SMA100 99.35
Daily SMA200 97.59
 
Levels
Previous Daily High 104.62
Previous Daily Low 104.35
Previous Weekly High 104.56
Previous Weekly Low 103.48
Previous Monthly High 105.04
Previous Monthly Low 97.78
Daily Fibonacci 38.2% 104.52
Daily Fibonacci 61.8% 104.45
Daily Pivot Point S1 104.37
Daily Pivot Point S2 104.22
Daily Pivot Point S3 104.1
Daily Pivot Point R1 104.65
Daily Pivot Point R2 104.78
Daily Pivot Point R3 104.93


Dow Jones Industrial Average tumbles almost 400 points on Wednesday

The Dow Jones Industrial Average (DJIA) is broadly lower on Wednesday, shedding nearly 400 points and backsliding into 38,500.00.
Leia mais Previous

Gold price tumbles on Wednesday as rising US yields boost Greenback

Gold prices slump on Wednesday amid rising US Treasury yields, boosting demand for the Greenback due to hawkish comments by a Federal Reserve (Fed) official.
Leia mais Next