Confirming you are not from the U.S. or the Philippines

Ao fornecer esta declaração, declaro e confirmo explicitamente que:
  • Não sou um cidadão nem residente nos EUA
  • Não sou residente nas Filipinas
  • Não possuo, direta ou indiretamente, mais de 10% de ações/direitos de voto/juros dos residentes dos EUA e/ou não controlo cidadãos ou residentes dos EUA por quaisquer outros meios
  • Não tenha propriedade, direta ou indireta, de mais de 10% de ações/direitos de voto/juros e/ou controlo cidadãos ou residentes dos EUA exercidos por outros meios
  • Não sou afiliado de cidadãos ou residentes dos EUA nos termos da Secção 1504(a) da FATCA
  • Tenho consciência da minha responsabilidade por prestar declarações falsas.
Para efeitos da presente declaração, todos os países e territórios dependentes dos EUA são equiparados de igual modo ao território principal dos EUA. Comprometo-me a defender e a considerar isenta a Octa Markets Incorporated, os seus diretores e oficiais relativamente a quaisquer reivindicações que surjam ou estejam relacionadas com qualquer violação da minha declaração no presente documento.
Dedicamo-nos à sua privacidade e à segurança das suas informações pessoais. Coletamos e-mails apenas para fornecer ofertas especiais e informações importantes sobre nossos produtos e serviços. Ao enviar seu endereço de e-mail, você concorda em receber nossas cartas. Se desejar cancelar a assinatura ou tiver alguma dúvida ou preocupação, entre em contato com o nosso Suporte ao Cliente.
Octa trading broker
Abrir conta de negociação
Back

USD/JPY Technical Analysis: Weekly close beyond 109.70/75 will be a call to bulls

  • USD/JPY trades positive near the two-week high, on a five-day winning streak.
  • Bullish engulfing on the weekly chart confronts 109.48/52 resistance confluence.
  • 200-week SMA adds to the resistance.

USD/JPY takes the bids to 109.55 during the initial trading session on Friday. In doing so, the pair registers a bullish candlestick formation on the weekly chart that currently confronts the key resistance confluence.

In addition to 109.48/52 area including 50% Fibonacci retracement of October 2018 top to August 2019 low and a downward sloping trend line since November 2018, 200-week SMA around 109.70/75 also challenges the buyers.

If at all USD/JPY prices register a weekly closing beyond 109.75, it confirms the bullish engulfing candlestick pattern on the chart while also the bulls to aim for the late-May top near 110.00.

Following that, 61.8% Fibonacci retracement level of 110.70 and April 2019 high of 112.40 will lure the buyers.

On the downside, pair’s declines below 108.45/40 hold the key to 108.00 and 107.50 support levels. However, the pair’s drop beneath 107.50 might not refrain from dragging the quote to the sub-107.00 region.

USD/JPY weekly chart
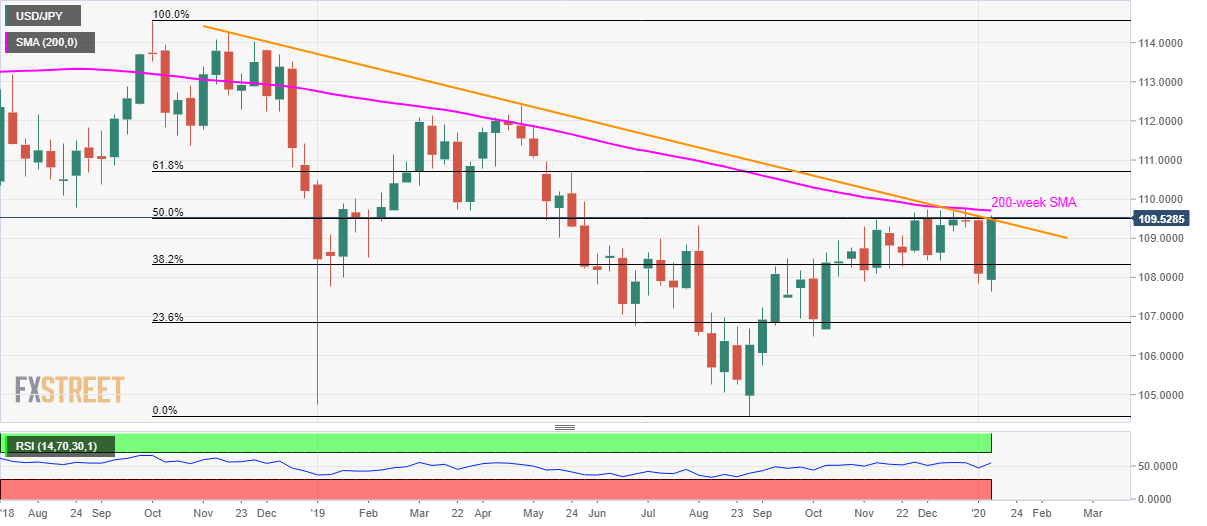
Trend: Bullish


BI Survey: Indonesia's Retail Sales rise 1.3% YoY in Nov, Rupiah at 21-month highs

Indonesia's Retail Sales grew by 1.3% on the year in November vs. a 3.6% jump seen in October, the latest survey conducted by Bank Indonesia (BI), the
Leia mais Previous

India: Increase in headline inflation to bring an end to easing cycle – Capital Economics

In their latest client note, analysts at Capital Economics note that India’s headline retail inflation likely accelerated to a five-year high in Decem
Leia mais Next