Back
20 Jan 2020
USD/JPY New York Price Forecast: Greenback holding above the 110.05 support level vs. yen
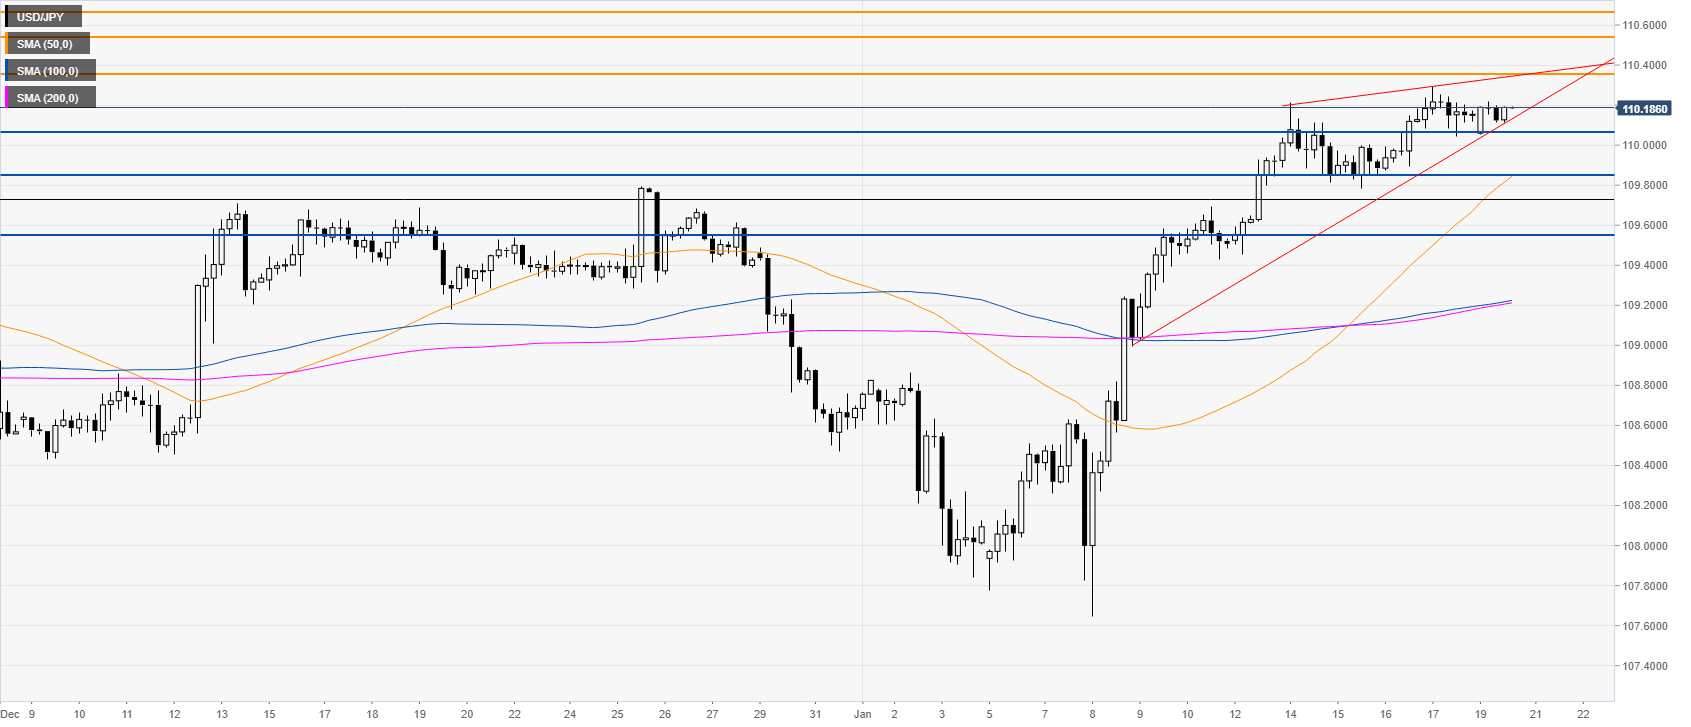
- USD/JPY is trading in a rising wedge pattern.
- The market can become vulnerable below the 110.05 support level.
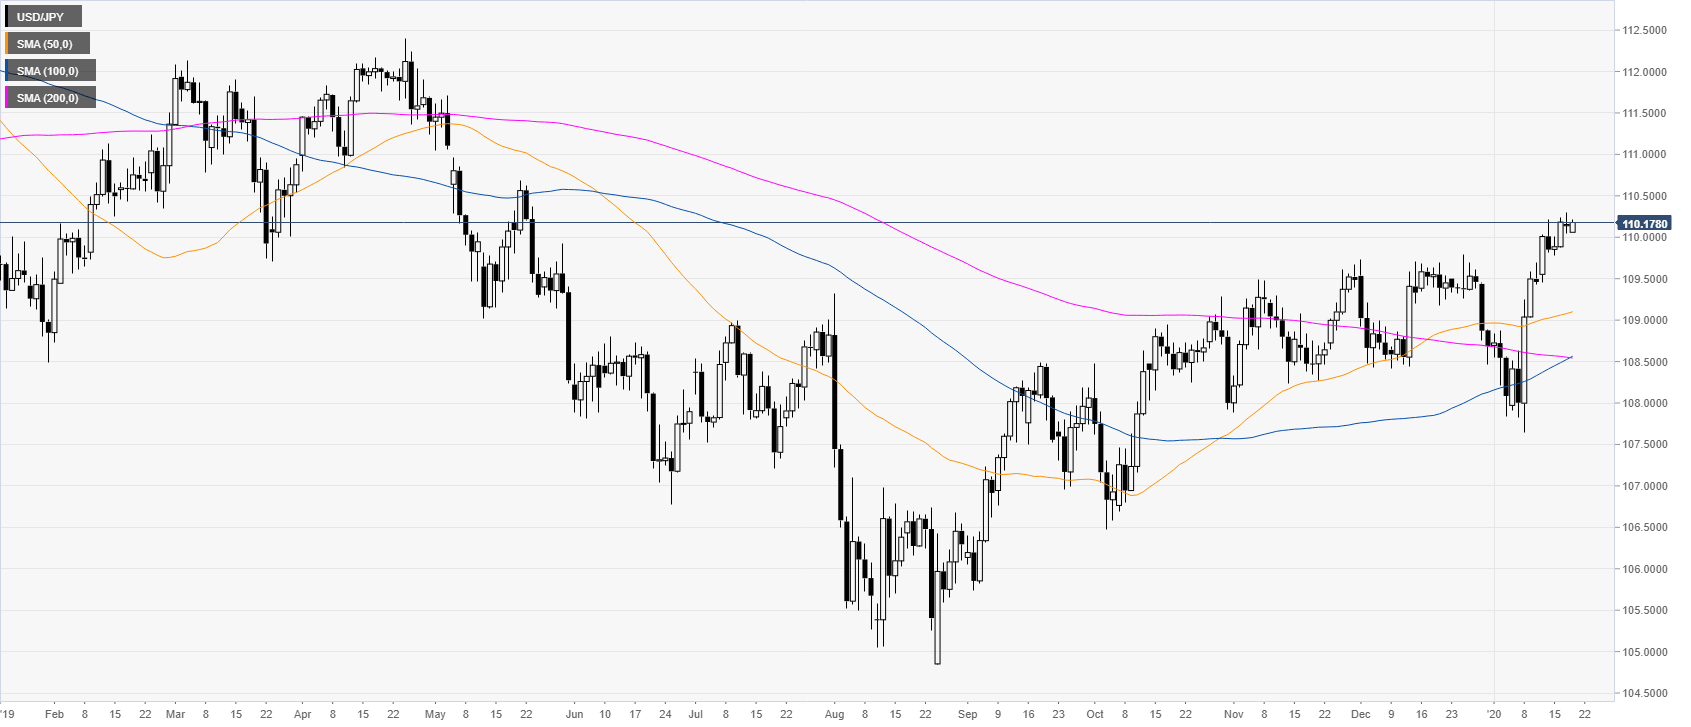
USD/JPY daily chart
USD/JPY is in consolidation mode after the January spike above the 110.00 handle and the main simple moving averages (SMAs). The spot is hovering near its highest since mid-May 2019.
USD/JPY four-hour chart
USD/JPY is trading in a wedge pattern while trading above the main SMAs. Bulls are defending the 110.05 support while maintaining the market in a tight range above the level. If the bullish grind keeps going the market could reach the 110.35 level and a break above it can open the gates to 110.52 and 110.69, according to the Technical Confluences Indicator.
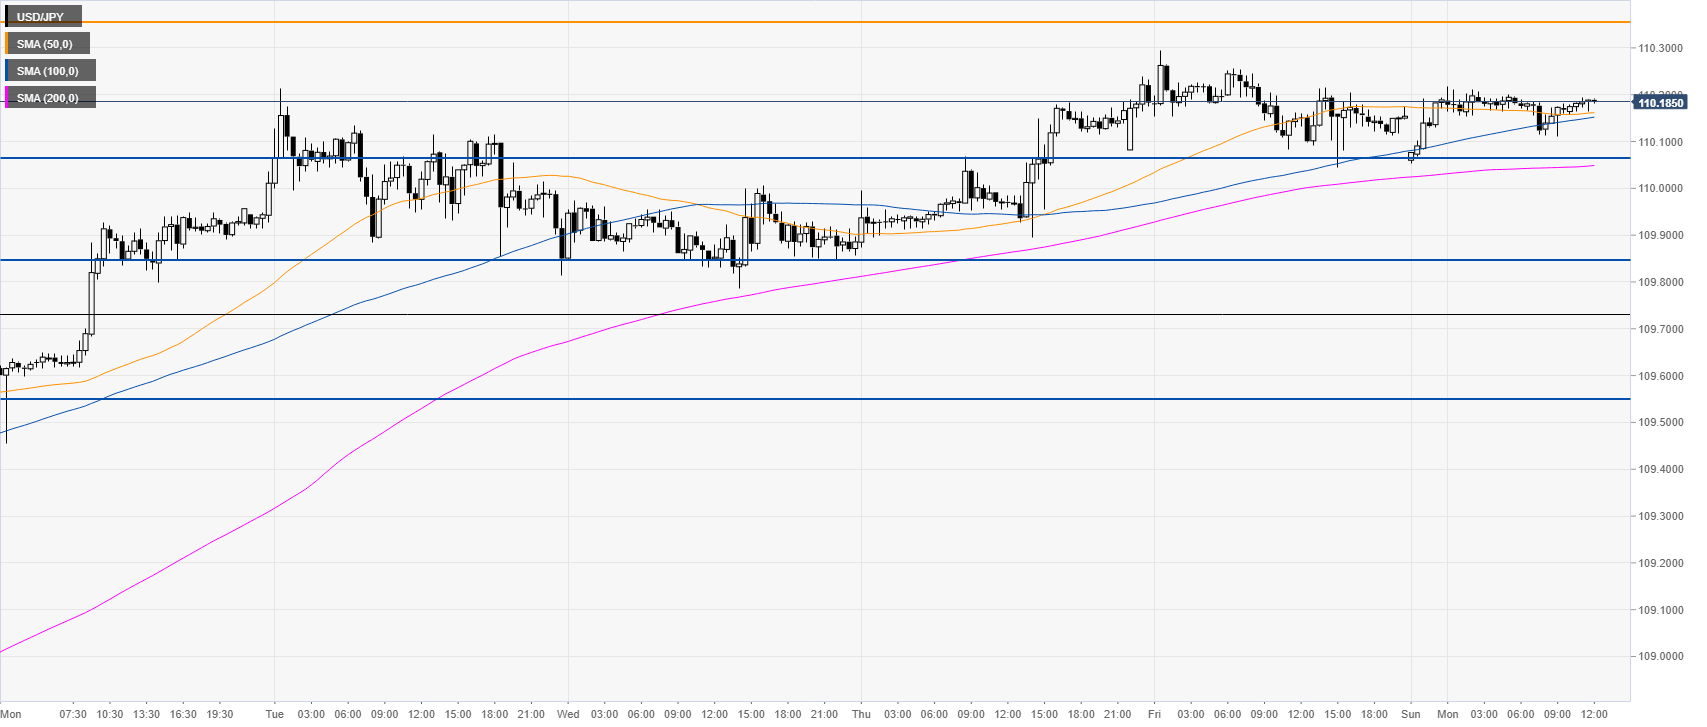
USD/JPY 30-minute chart
The market is grinding up above the main SMAs, however, if the bears breach 110.05 support, the spot might decline towards the 109.85 and 109.55 levels, according to the Technical Confluences Indicator.
Additional key levels