Confirming you are not from the U.S. or the Philippines

Ao fornecer esta declaração, declaro e confirmo explicitamente que:
  • Não sou um cidadão nem residente nos EUA
  • Não sou residente nas Filipinas
  • Não possuo, direta ou indiretamente, mais de 10% de ações/direitos de voto/juros dos residentes dos EUA e/ou não controlo cidadãos ou residentes dos EUA por quaisquer outros meios
  • Não tenha propriedade, direta ou indireta, de mais de 10% de ações/direitos de voto/juros e/ou controlo cidadãos ou residentes dos EUA exercidos por outros meios
  • Não sou afiliado de cidadãos ou residentes dos EUA nos termos da Secção 1504(a) da FATCA
  • Tenho consciência da minha responsabilidade por prestar declarações falsas.
Para efeitos da presente declaração, todos os países e territórios dependentes dos EUA são equiparados de igual modo ao território principal dos EUA. Comprometo-me a defender e a considerar isenta a Octa Markets Incorporated, os seus diretores e oficiais relativamente a quaisquer reivindicações que surjam ou estejam relacionadas com qualquer violação da minha declaração no presente documento.
Dedicamo-nos à sua privacidade e à segurança das suas informações pessoais. Coletamos e-mails apenas para fornecer ofertas especiais e informações importantes sobre nossos produtos e serviços. Ao enviar seu endereço de e-mail, você concorda em receber nossas cartas. Se desejar cancelar a assinatura ou tiver alguma dúvida ou preocupação, entre em contato com o nosso Suporte ao Cliente.
Octa trading broker
Abrir conta de negociação
Back

AUD/USD Price Analysis: Bears monitoring for failures at resistance

  • AUD/USD bears need a break of support to confirm a downside bias. 
  • Bulls are in charge while testing deeper into the weekly resistance. 

AUD/USD bulls in charge on the longterm time frames, but a close below resistance will open prospects of a retracement of the daily bullish impulse. 

The following is a topdown analysis that illustrates where the next opportunity could arise on the lower time frames.

Weekly chart, AUD/USD
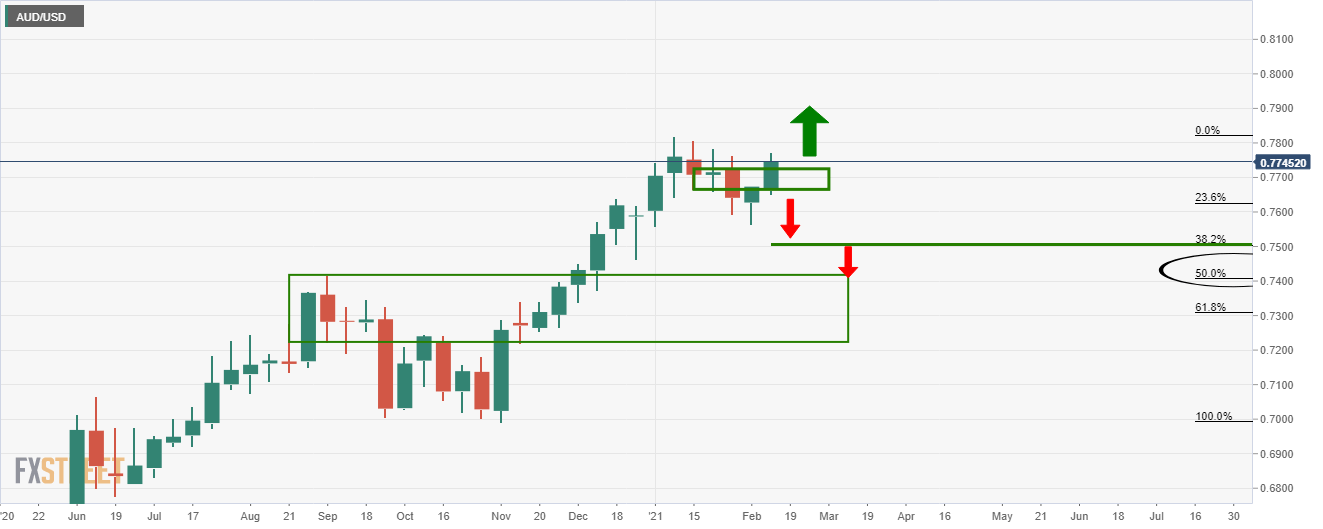
There is an upside bias so long as the price remains above this newly formed support following the recent bullish weekly test of resistance. 

A weekly close above the prior highs will negate downward trade setups. 

Daily chart, AUD/USD
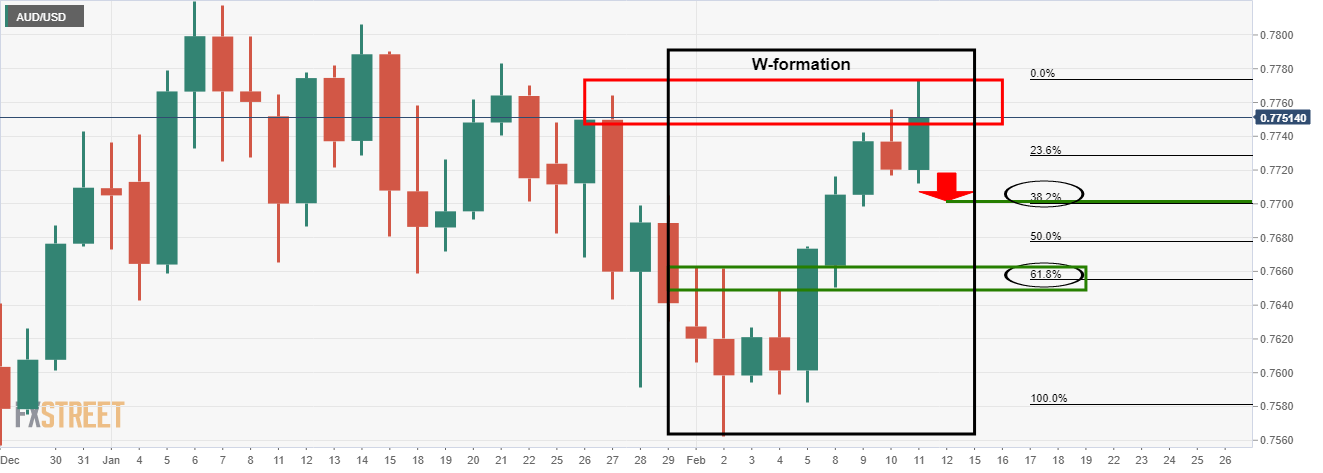
With that being said, the daily chart is offering a different scenario. 

The W-formation is a bearish chart pattern that would expect to see at least a 38.2% Fibonacci retracement of the bullish impulse.

A test of the 0.77 figure is, therefore, to play for still. However, a daily close above the prior day's highs will be bullish. 

4-hour chart, AUD/USD
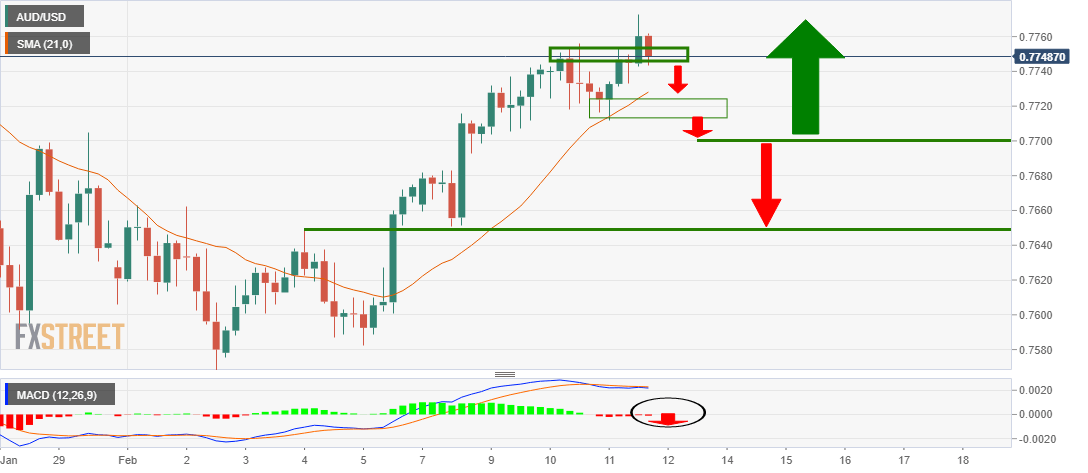
The conditions on the 4-hour chart are bullish.

There is little in the way of a high probability setup that can be taken by the bears in targeting 0.77 the figure until the bearish structure has been forme, or MACD is below the zero line and price below the 21 moving average. 

Given the proximity of the 0.77 figure and price, there is little in the way of reward and a lower time frame would be more appropriate in this scenario. 

1-hour chart
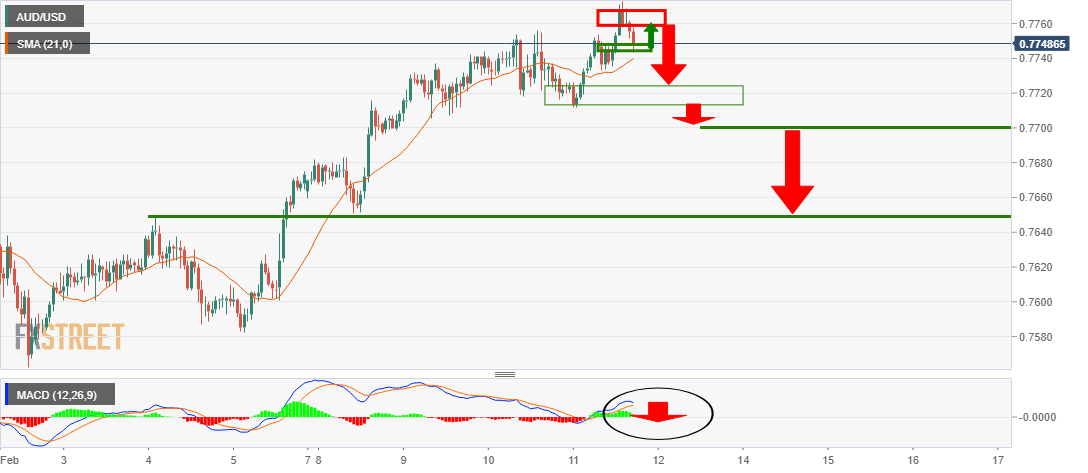
The 1-hour chart offers prospects of a trade set up if the price breaks support and retests the structure from resistance.

A break below the lows will open risk towards the neckline of the daily M-formation and confluence of a 61.8% Fibonacci retracement of the daily impulse around 0.7650. 

United States 30-Year Bond Auction up to 1.933% from previous 1.825%

United States 30-Year Bond Auction up to 1.933% from previous 1.825%
Leia mais Previous

Data from UK and Israel show COVID-19 vaccines are working – Danske Bank

Assessing the latest developments surrounding the coronavirus, Danske Bank analysts noted that new data from Israel and the UK show that the vaccines
Leia mais Next