Confirming you are not from the U.S. or the Philippines

Ao fornecer esta declaração, declaro e confirmo explicitamente que:
  • Não sou um cidadão nem residente nos EUA
  • Não sou residente nas Filipinas
  • Não possuo, direta ou indiretamente, mais de 10% de ações/direitos de voto/juros dos residentes dos EUA e/ou não controlo cidadãos ou residentes dos EUA por quaisquer outros meios
  • Não tenha propriedade, direta ou indireta, de mais de 10% de ações/direitos de voto/juros e/ou controlo cidadãos ou residentes dos EUA exercidos por outros meios
  • Não sou afiliado de cidadãos ou residentes dos EUA nos termos da Secção 1504(a) da FATCA
  • Tenho consciência da minha responsabilidade por prestar declarações falsas.
Para efeitos da presente declaração, todos os países e territórios dependentes dos EUA são equiparados de igual modo ao território principal dos EUA. Comprometo-me a defender e a considerar isenta a Octa Markets Incorporated, os seus diretores e oficiais relativamente a quaisquer reivindicações que surjam ou estejam relacionadas com qualquer violação da minha declaração no presente documento.
Dedicamo-nos à sua privacidade e à segurança das suas informações pessoais. Coletamos e-mails apenas para fornecer ofertas especiais e informações importantes sobre nossos produtos e serviços. Ao enviar seu endereço de e-mail, você concorda em receber nossas cartas. Se desejar cancelar a assinatura ou tiver alguma dúvida ou preocupação, entre em contato com o nosso Suporte ao Cliente.
Octa trading broker
Abrir conta de negociação
Back

USD/JPY Price Analysis: Bulls and bears battle it out at daily resistance

  • USD/JPY bulls in charge but weekly and daily resistance should be noted. 
  • Bears are seeking to hold the bulls off at this juncture.

The bulls are in town according to the monthly chart but the weekly chart is making for a meanwhile resistance and problematic.

The following is a top-down analysis that illustrates the market structure across the time frames and subsequent bias. 

Monthly chart

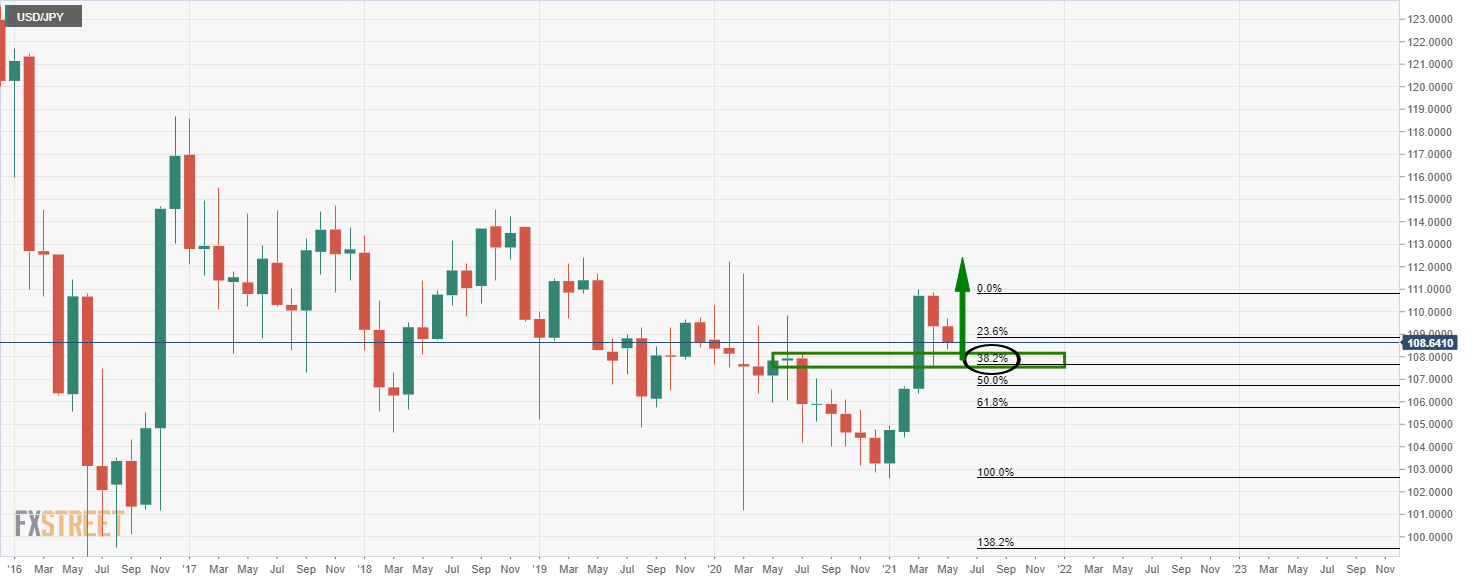
The bullish bias is derived from the recent correction of the monthly bullish impulse to test the prior highs and what would be expected to be a support zone.

The price can rally to fresh highs from here.

Weekly chart

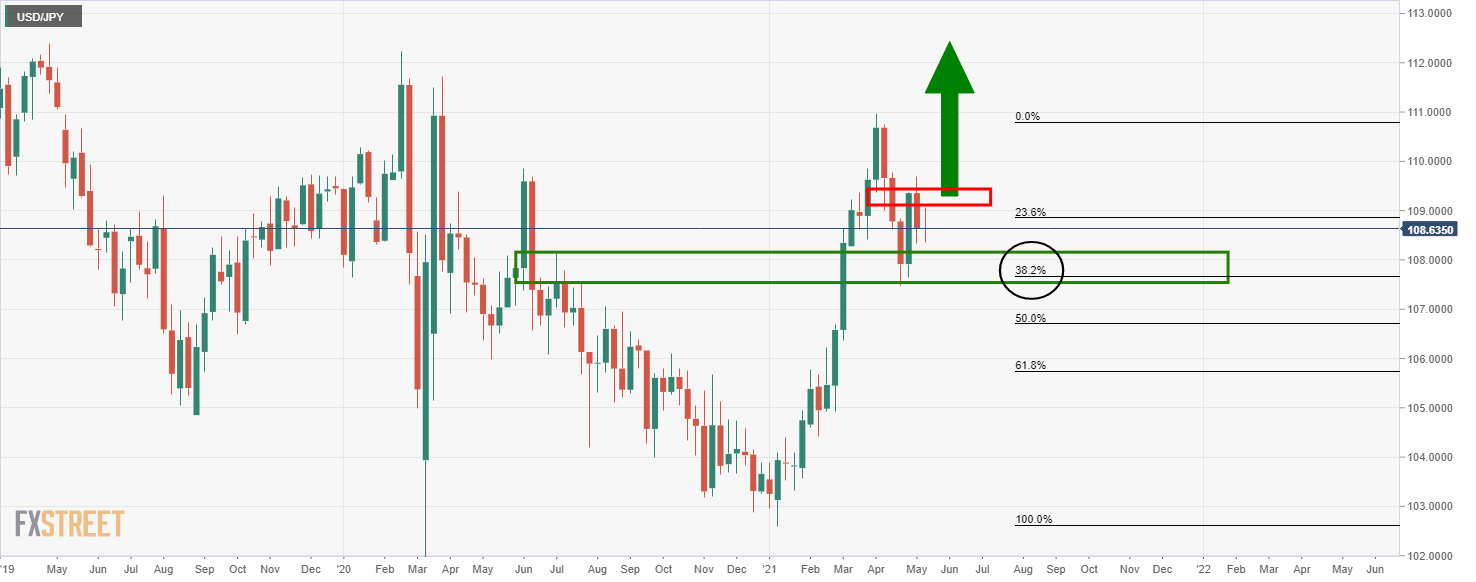
Meanwhile, the weekly resistance is a stumbling block for the bulls. 

Daily chart

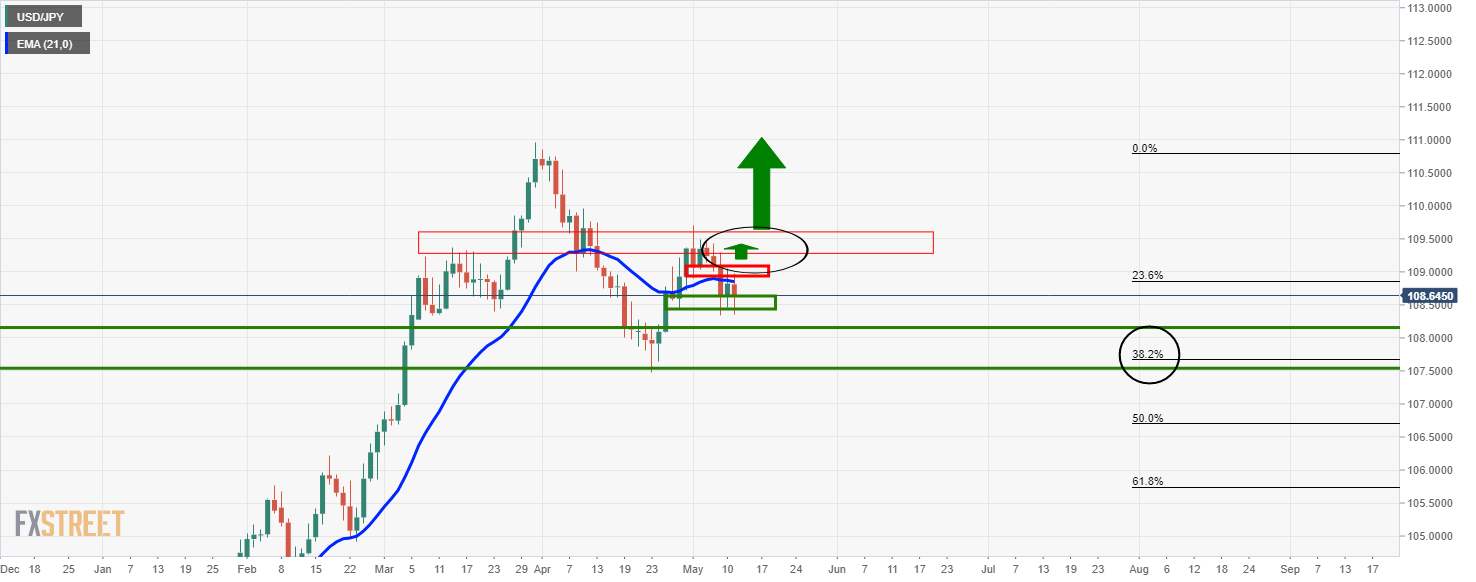
The daily time frame shows that the price is testing a prior support structure in an M-formaiton. 

A beak of this resistance will be highly bullish. 

Fed's Harker: Fed to pare back asset purchases before raising rates

Before raising the federal funds rate, the Federal Reserve would pare back asset purchases, Philadelphia Fed President Patrick Harker said on Tuesday,
Leia mais Previous

Fed's Bullard: US will see inflation in 2021 and some will “hang on” in 2022

In a CNBC interview, Federal Reserve James Bullard has stated that the US will see inflation in 2021 and some will "hang on" in 2022. He said that nfl
Leia mais Next